The goal of TB-Vis is to visualize genetic relationships among Mycobacterium tuberculosis complex (MTC) and their association with host populations to address molecular epidemiological questions. TB-Vis consists of two visualization methods: 1) Host-pathogen maps,2) Spoligoforests. TB-Vis is currently not available.
1. Host-pathogen maps:
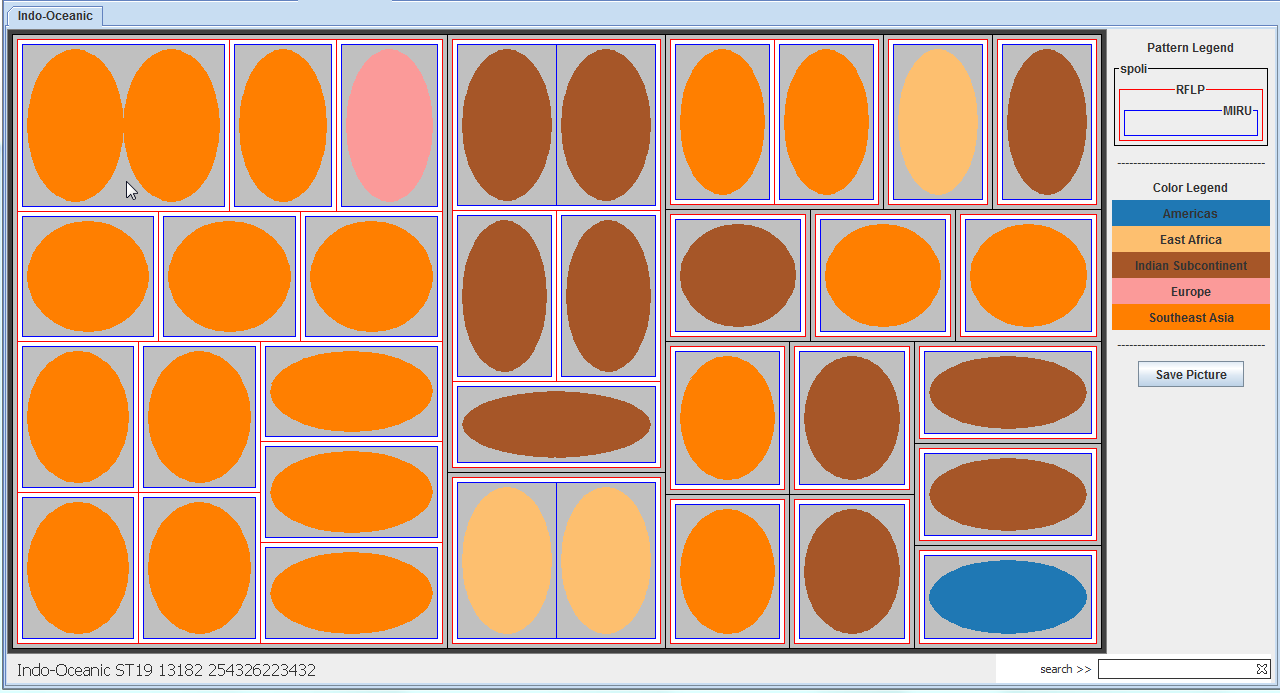
Host-pathogen maps allow simultaneous overview of patient and strain data. These maps visualize genotype clusters of MTC strains based on multiple biomarkers, as well as their associations
with attributes of patients infected by them. Figure 1 shows the host-pathogen tree-map of patients infected with Indo-Oceanic strains in the NYS dataset. Each patient is represented as a node within
nested boxes. The nodes are colored by TB continent of the patient based on country of birth. The boxes surrounding the patient node represent biomarkers of MTC strain which infected the patient.
In the figure, first level biomarker is Spacer Oligonucleotide Type (spoligotype), second level biomarker is IS6110 Restriction Fragment Length Polymorphism (RFLP), and third level biomarker is Mycobacterium Interspersed
Repetitive Unit - Variable Number Tandem Repeats (MIRU-VNTR). Genotype clusters are narrowed down using multiple biomarkers, leading to more accurate cluster investigations based on patient
attributes. Thus, host-pathogen maps provide a view from perspectives of both the host and the pathogen, and helps molecular epidemiologists and clinicians identify possible outbreaks which can
be verified by further examination of epidemiological links.

|
| Figure 1: Host-pathogen tree-map of patients in NYS dataset infected with Indo-Oceanic strains. |
2. Spoligoforests:
Spoligotyping is a DNA fingerprinting method that exploits the polymorphisms in the direct repeat (DR) region. The genetic associations and possible
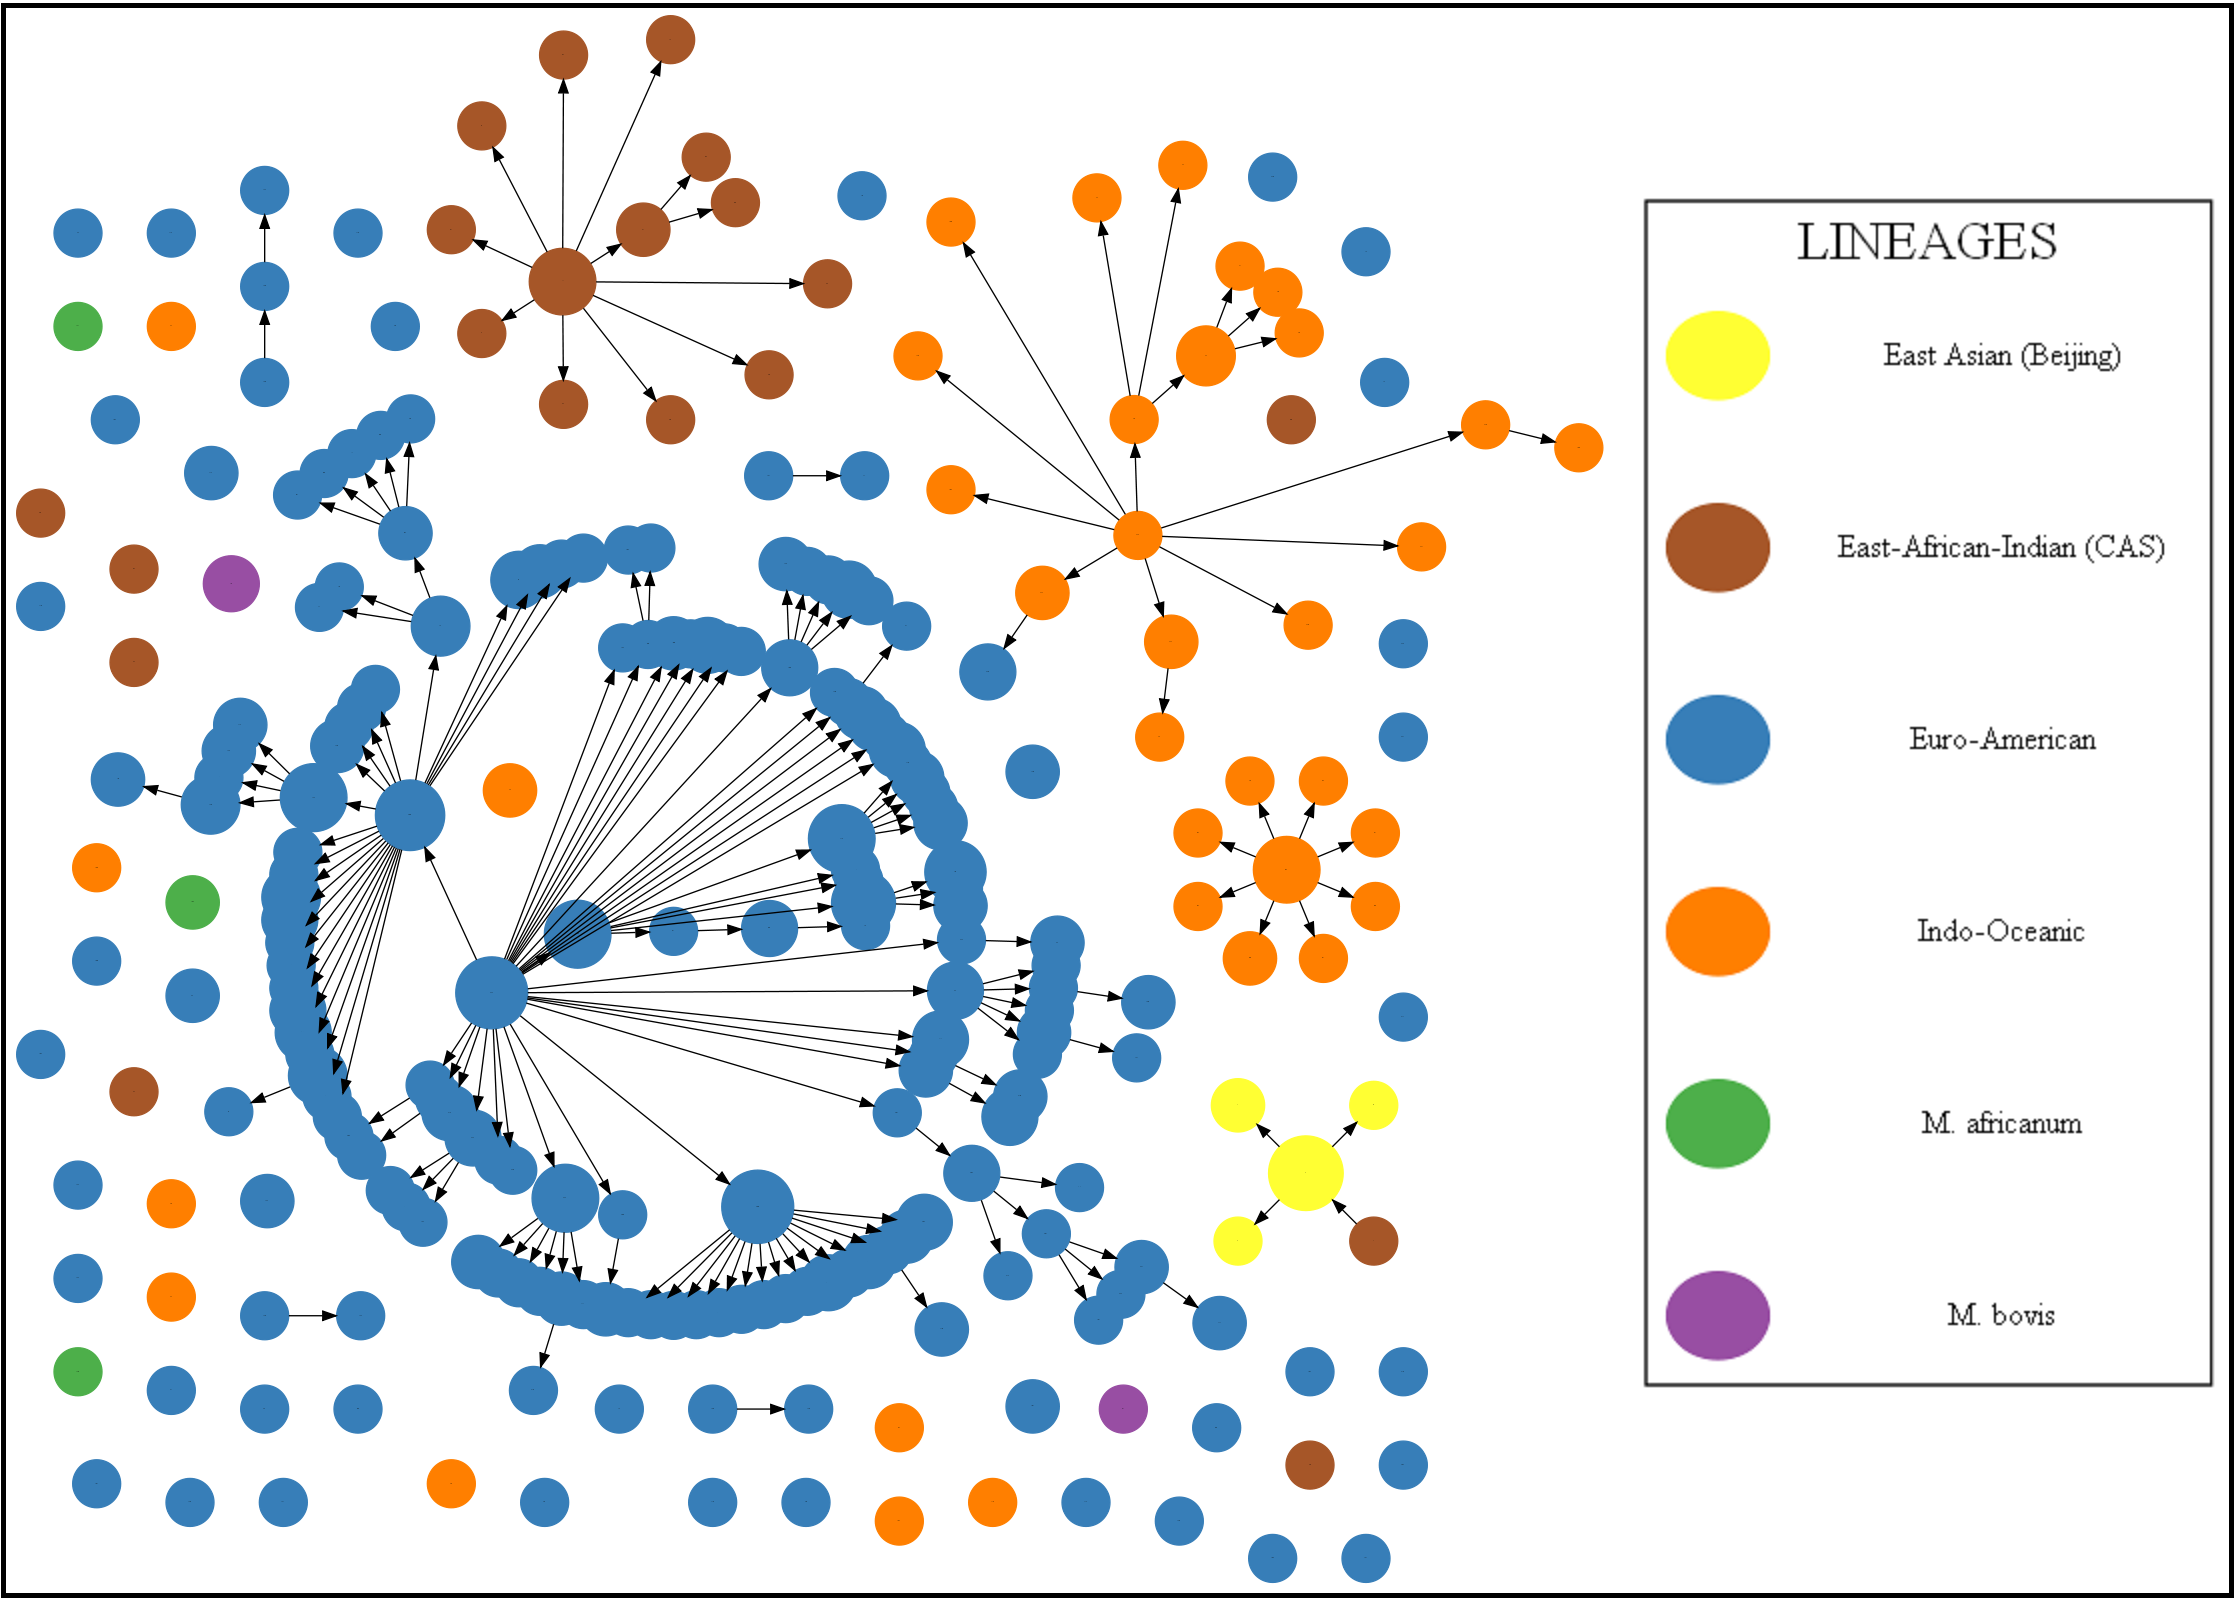
mutations of spoligotypes of MTC can be visualized by the maximum parsimonious forest of spoligotypes, called spoligoforests, Figure 2 shows the spoligoforest of NYS patient dataset.
Each node in the spoligoforest represents a spoligotype, colored based on the lineage of MTC with specified spoligotype. Each edge represents a potential mutation event from parent spoligotype
into the child. If only spoligotypes are available, the edges are determined based on Hamming distance between spoligotypes. If MIRU types are also available, then the edges are determined using the following distances: 1) Hamming distance between MIRUs, 2) Hamming distance between spoligotypes, 3) Euclidean distance
between MIRUs. In case of a tie, the parent spoligotype is randomly picked from the remaining candidate set of parent spoligotypes. Thus, the spoligoforests visualize genetic associations
among MTC strains based on spoligotypes, and also MIRU types if available, giving insights into the genetic diversity and evolution of MTC strains.

|
| Figure 2: The spoligoforest of MTC strains which infected patients in NYS dataset. |


